3.7. Lock-In Amplifier Background
What is a Lock-In Amplifier?
A lock-in amplifier can detect signals at a known reference frequency. This reference frequency is either generated internally, or detected from an external source using a phase locked loop (PLL). The reference signal is then supplied to a phase sensitive detector (PSD). This is the core of the lock-in’s signal processing, consisting of a multiplier and a low-pass filter:

Figure 3.19 Phase sensitive detector
Additional filtering is often employed, but consider a filter with an output \(y(t)\), which is an average over a single period \(T\) of the reference signal. For an given input \(x(t)\) and a sinusoidal reference, this gives:
For an input signal that is also a sine wave at the same frequency as the reference, the output of this filter has a non-zero mean corresponding to half the amplitude of the input signal. For example if the input is a 0.5 V sine wave at 1 kHz in phase with a 1 kHz reference:
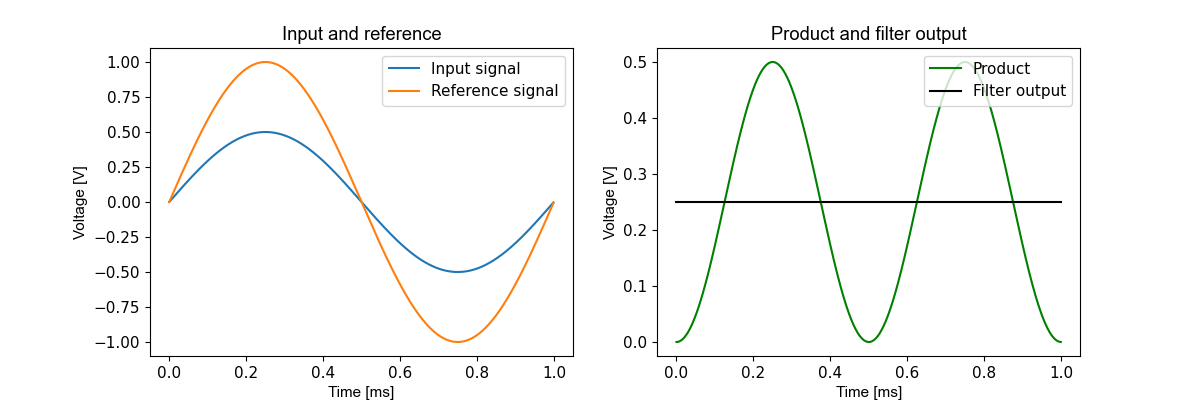
Figure 3.20 Sine wave input
However for other frequencies, the output has zero mean. For example if the input is a 0.5 V sine wave at 2.6 kHz:
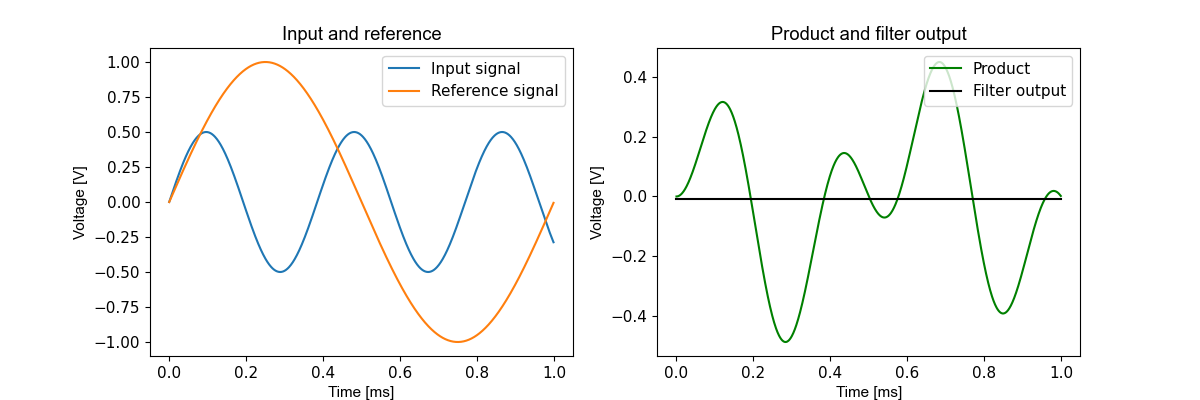
Figure 3.21 2.6 kHz input
The product has no mean, and because the difference in frequencies is 1.6 kHz, the slowest frequency component of the product is 1.6 kHz, so this is easily rejected by the low-pass filter. Frequencies close to to the reference frequency will not be rejected. Lower cut-off frequencies for the low-pass filter make the PSD more selective.
Why use a Lock-In Amplifier?
The selective nature of the phase sensitive detector is very useful when a signal of interest must be extracted from noise. The components of the noise at other frequencies are rejected by the filter.
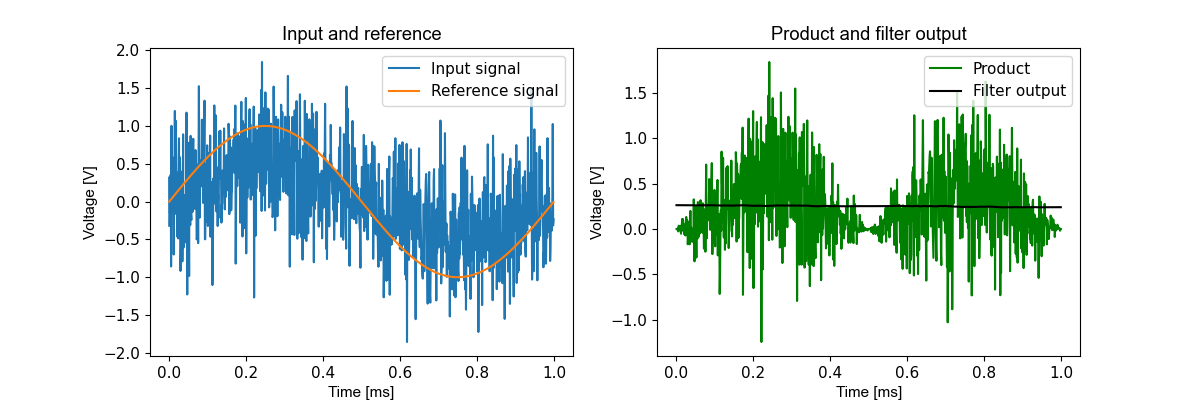
Figure 3.22 Noisy input
Other Lock-In Functions
The PSD described above responds to signals that are in phase with the reference. A signal that is shifted 90° from the reference produces zero mean.
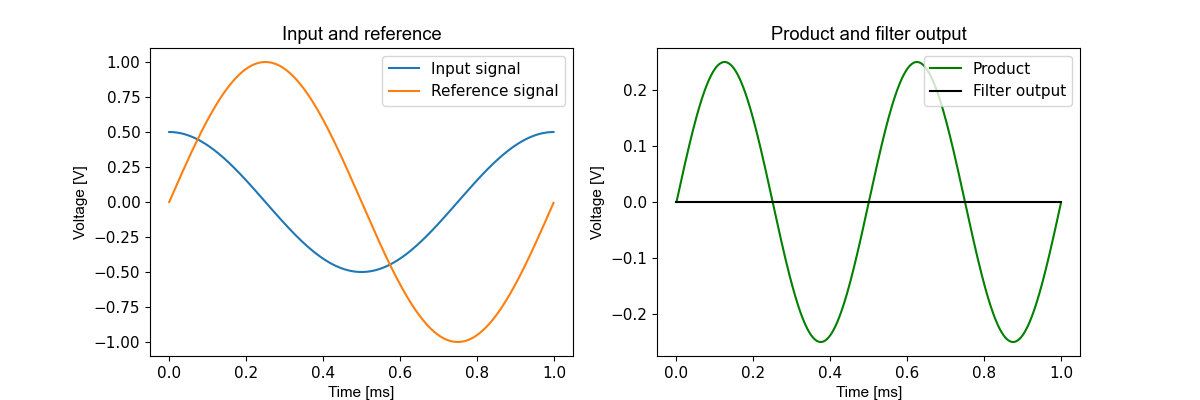
Figure 3.23 Phase shifted input
To provide a full picture of the signal that is at the reference frequency, each channel of the M81-SSM has two PSDs. The reference fed to the second PSD is shifted 90°. This makes that detector sensitive to the signals that are out of phase with the reference signal.

Figure 3.24 Full detector
Together, these two detectors can detect the magnitude and phase of the input signal. The M81-SSM can display this information in either rectangular coordinates \((X,Y)\) or polar coordinates \((R,\theta)\). The polar coorinates are converted from the detector outputs as follows:
As shown above, the M81-SSM also has the capability of multiplying the reference frequency. This allows the detection of input signals that are harmonics of the reference frequency.
Additionally a phase shift can be applied to the reference. This modifies the phase of input signal, which results in a measurement of zero degrees.
Choosing Lock-In Filter Settings
There are software filters that affect the behavior of the lock-in measurement. This section explains how to determine the software filter settings for the best possible lock-in measurement. The hardware filters in measure modules are not connected to these software filters.
Time constant and roll off
The primary lock-in filter is an infinite impulse response (IIR) filter. The time constant and roll off settings control this filter.
The filter provides the choice between settling time (measurement speed) and noise in the measurement band (equivalent noise bandwidth or ENBW). Longer settling times provide more repeatable measurements at the expense of the measurement rate.
A step change in the measured signal will cause the output to change forever. It is important to be aware of this behavior when choosing the time constant and roll off settings of the lock-in IIR filter. Capturing dynamically changing signals requires low settling times.
The table below shows the ENBW and amount of time needed to settle within a certain percentage of the final value. These are shown in terms of number of time constants (\(\tau\)). For example, if the lock-in time constant is 1 s and the rolloff is 18 dB it will take 11.23 s for the lock-in indication to be within 0.1% of the final value after an input step change. If the time constant is 0.1 s it will take only 1.123 s for the lock-in indication to be within 0.1% of the final value after a step change.
Example calculations
Rolloff setting [dB] |
ENBW [Hz] |
1% settle time [s] |
0.1% settle time [s] |
0.01% settle time [s] |
10 ppm settle time [s] |
|---|---|---|---|---|---|
\[6\]
|
\[\frac{1}{4\tau}\]
|
\[4.61\tau\]
|
\[6.91\tau\]
|
\[9.21\tau\]
|
\[11.51\tau\]
|
\[12\]
|
\[\frac{1}{8\tau}\]
|
\[6.64\tau\]
|
\[9.23\tau\]
|
\[11.76\tau\]
|
\[14.24\tau\]
|
\[18\]
|
\[\frac{3}{32\tau}\]
|
\[8.41\tau\]
|
\[11.23\tau\]
|
\[13.93\tau\]
|
\[16.55\tau\]
|
\[24\]
|
\[\frac{5}{64\tau}\]
|
\[9.98\tau\]
|
\[13.03\tau\]
|
\[15.91\tau\]
|
\[18.65\tau\]
|
Reference cycles
In addition to the primary low-pass filter there is an Averaging Filter that averages over one period (cycle) of the reference frequency to reduce the effect of the reference signal on the lock-in measurement. The number of cycles is configurable. More cycles result in improved rejection of the reference signal interference at the cost of longer settling times. For example if the FIR filter is configured to average over 10 cycles and the reference frequency is 7 Hz the filter averaging time will be \(\frac{10}{7\ Hz}\) = 1.429 s.