3.4. Dashboard View
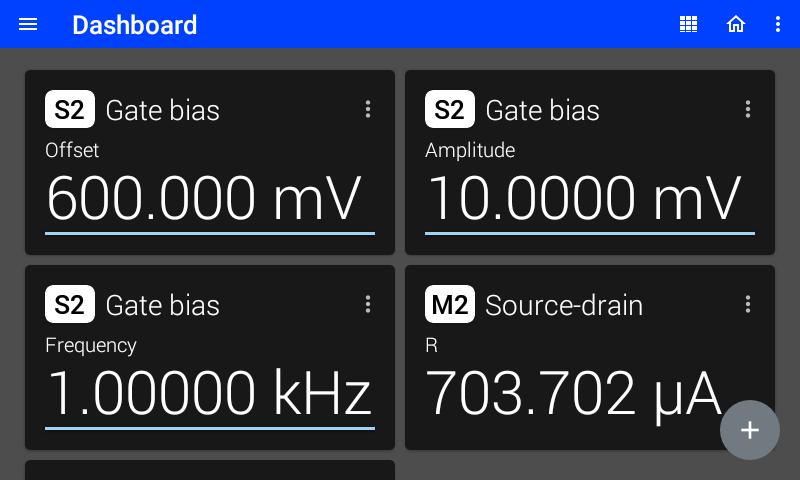
The M81-SSM can display the measurements and source settings of multiple modules using the dashboard. The dashboard is customizable, and some settings may be edited from this view. The dashboard is saved as part of a Settings profile.
To navigate to the dashboard, tap the icon on the top right that resembles a grid of boxes. This is the dashboard icon.

Figure 3.14 example dashboard
Configuring the dashboard
To add a panel to the dashboard, tap the “+” icon. You will be prompted to select a module, a parameter, and a parameter type. A panel will then appear on the dashboard containing the selected parameter.
To change the contents of a panel or to delete a panel, tap the three dots in the top right corner of the panel. To remove all of the panels, tap the three dots in the top right corner of the screen.
To rearrange the panels, tap and hold the panel you would like to move. You may then drag it to the desired position.
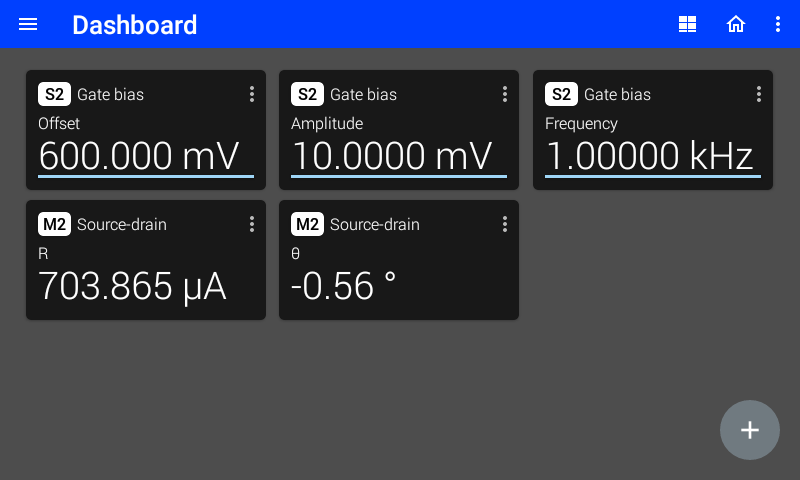
If you would like to fit more panels on the screen, tap the dashboard icon again.

Figure 3.15 example dashboard with small panels
To return to the home screen, tap the icon in the top right that resembles a house.
Dashboard Interactions
From the dashboard, you are able to tap the underlined value of a source pod to edit that value.
You are also able to tap the underlined value on a “Minimum” or “Maximum” parameter, which will reset all minimum or maximum calculations.