4.1. Curve Setup and Usage
Introduction
At a given temperature, electronic temperature sensors produce either a voltage or a resistance that is a function of temperature. A group of sensor value to temperature pairs are called breakpoints. Breakpoints and header parameters together form a curve file, or more succinctly, a curve. Lake Shore provides curves to users in a file using the .340 file format. A .340 file format is an ASCII text file that can be read using ColdSync™. This process is described later in this section.
The Model 346 has 20 standard curve locations, numbered 1 through 20. Currently, not all locations are occupied by curves; the others are reserved for future updates. Standard curves cannot be changed by the user, and reserved locations are not available for user curves.
The Model 346 has 40 user curve locations, numbered 21 through 60. Each location can hold up to 200 breakpoints, including a value in sensor units and a corresponding value in kelvin. Using fewer than 200 breakpoints will not increase the number of available curve locations.
Note
A curve requires at least 2 points to be valid
Curve Header Parameters
Each curve has parameters that are used for identification and to allow the instrument to use the curve effectively. The parameters must be set correctly before a curve can be used for temperature conversion or temperature control. When using calibrated curves provide by Lake Shore, these values are set correctly in the .340 file.
Name: defaults to the Sensor Model field in the .340 file. However, ColdSync™ allows for entry of a custom curve name up to 31 characters long.
Serial Number: a sensor serial number of up to 15 characters (letters or numbers) is assigned to the curve within the .340 file.
Format: the format parameter tells the instrument what breakpoint data format to expect. Different sensor types require different formats. Formats for Lake Shore sensors are described in the table Table 4.1.
Setpoint Limit: limits the control setpoint to values less than or equal to this setting. A setpoint limit is included with every curve, and is usually set to the highest temperature in the curve.
Temperature Coefficient: the temperature coefficient is derived by the Model 346 from the first two breakpoints. A positive coefficient indicates that the sensor value increases with increasing temperature. A negative coefficient indicates that the sensor signal decreases with increasing temperature.
Number |
Format |
Description |
Sensor units full-scale range |
Sensor units maximum resolution |
|---|---|---|---|---|
1 |
mV/K |
Millivolts vs. kelvin for thermocouple sensors |
±100 mV |
0.0001 mV |
2 |
V/K |
Volts vs. kelvin for diodes |
10 V |
0.00001 V |
3 |
Ω/K |
Resistance vs. kelvin for PTC RTD sensors |
10 kΩ |
0.001 Ω |
4 |
LogΩ/K |
Log resistance vs. kelvin for NTC RTD sensors |
5 log Ω |
0.00001 log Ω |
Curve Breakpoints
As mentioned above, the temperature response data of a calibrated sensor must be reduced to a table of breakpoints before entering it into the instrument. A curve consists of 2 to 200 breakpoints and each breakpoint consists of one value in sensor units and one temperature value in kelvin. The Model 346 uses linear interpolation to calculate the temperature between breakpoints.
Note
If the sensor reading is outside of the range of the curve, the instrument extrapolates using last two points, up to a maximum of 50% lower than the lowest temperature point, or 5% higher than the highest temperature point.
The instrument will show T.OVER or T.UNDER on the display if the sensor reading is outside the extrapolated range of the breakpoints. Sensor units are defined by the format setting in table Table 4.1.
Breakpoint setting resolution is six digits in temperature. Most temperature values are entered with 0.001 resolution. Temperature values of 1000 K and greater can be entered to 0.01 resolution. Temperature values below 10 K can be entered with 0.0001 resolution. Temperature range for curve entry is 0 K to 9999.99 K.
Loading Curve Files with ColdSync™
A key feature of ColdSync™ is the ability to upload temperature curve files to the Model 346. It is also capable of reading curves from the Model 346 and writing them to a file for storage.
The ColdSync™ Curve Handler™ supports standard Lake Shore temperature curve files in the “.340” file format. Curve files are provided with calibrated sensors purchased from Lake Shore in the “.340” file format.
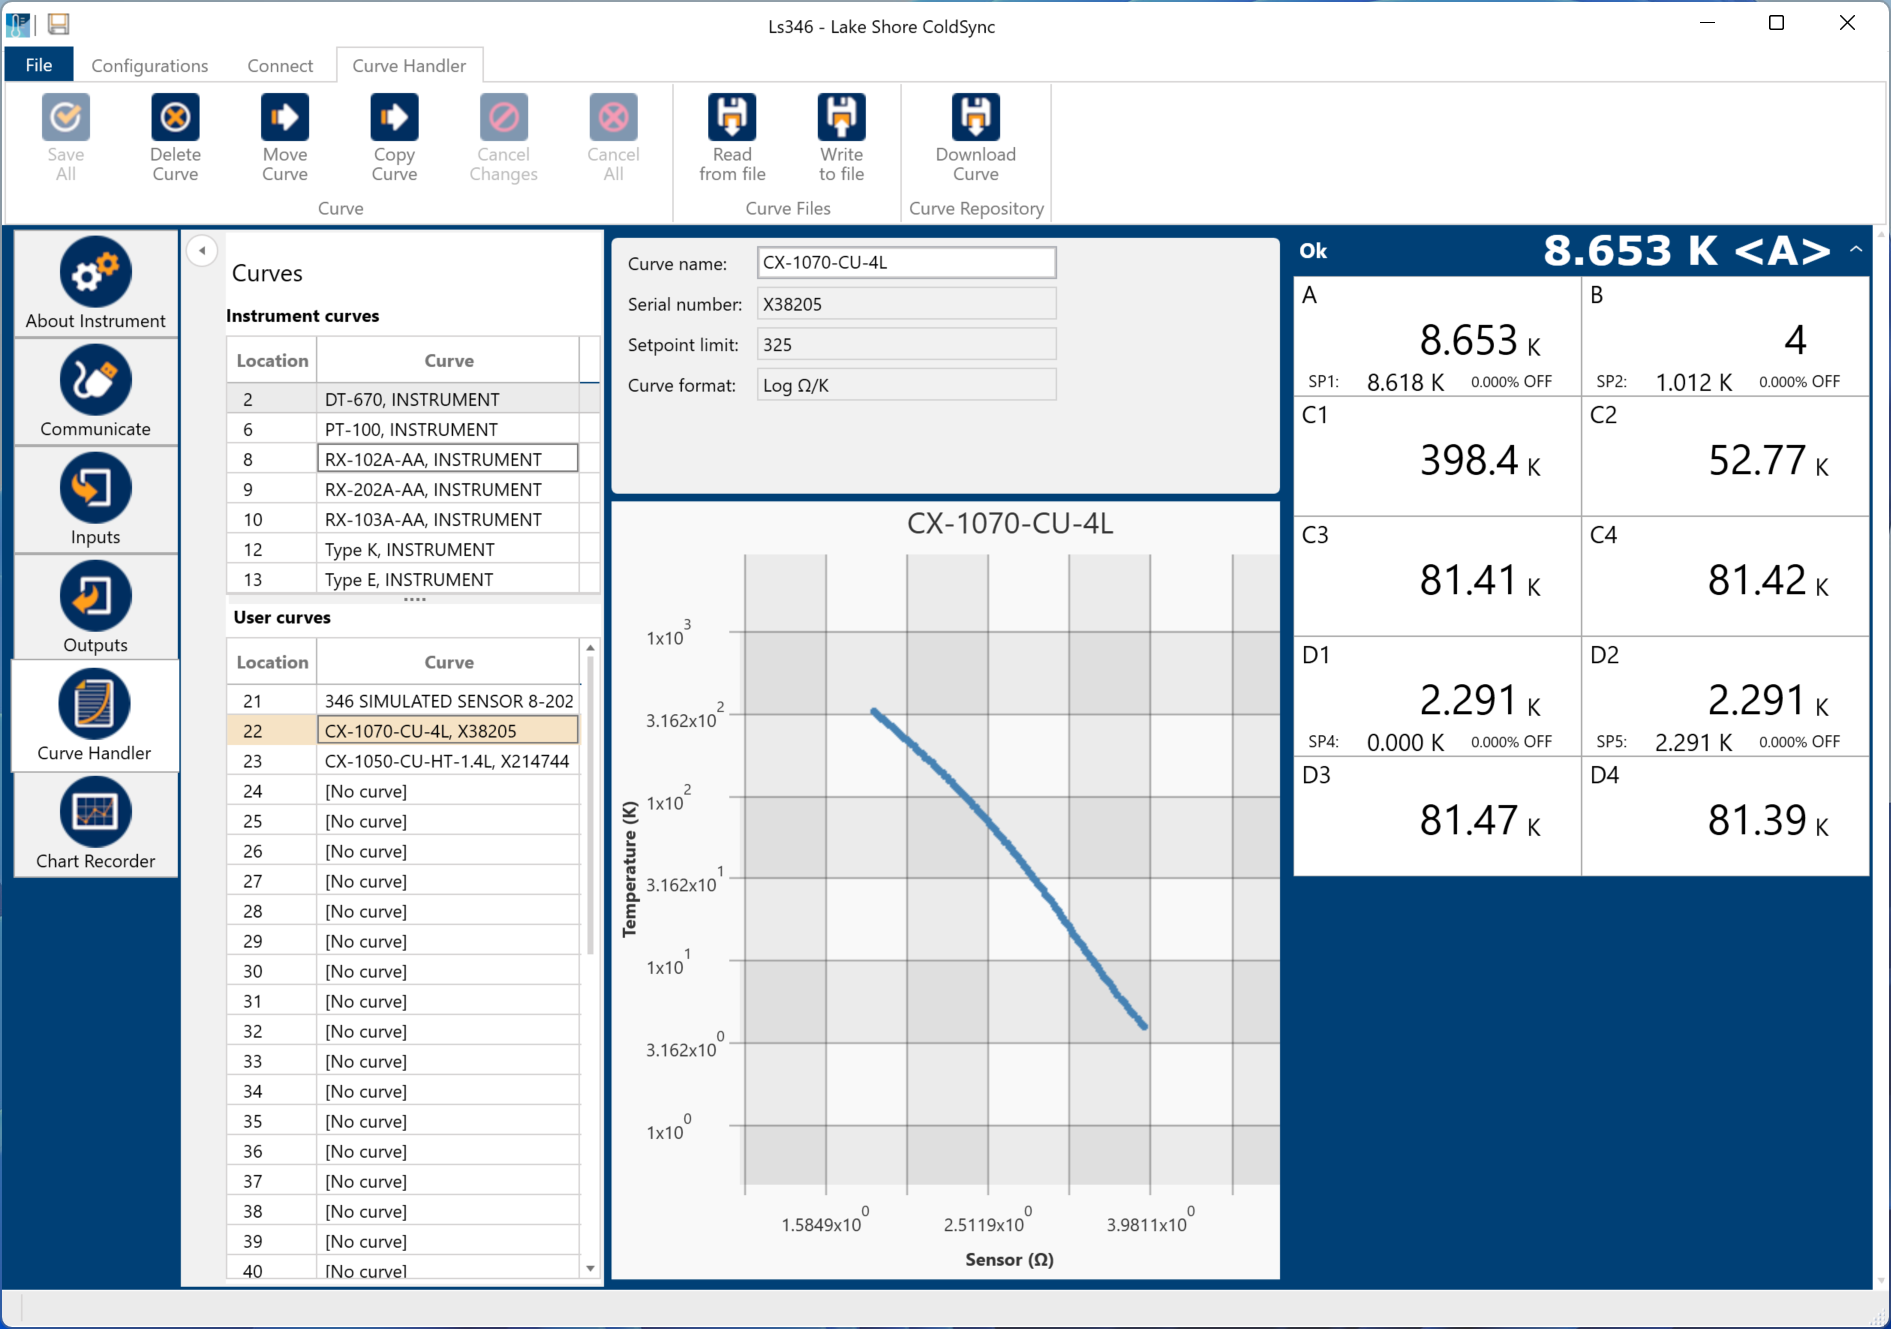
Figure 4.1 ColdSync™ curve handler screen
To load a temperature curve, follow this procedure.
Open ColdSync™ and press the toggle switch under Connection Status to connect to the Model 346.
On the left side of the window, press the Curve Handler button. A similar view to the one above should be present.
Under User curves, press the desired user curve location (21 to 60) to which the curve will be uploaded.
At the top of the window, press Read from file. A window will open allowing you to select the .340 curve file.
The curve should now appear in the window, similar to the one above. If desired, change the Curve name.
Navigate to the upper left of the window and press the Save All button.
After pressing OK when prompted, the curve will load into the Model 346 and a window will appear indicating that the curve was written successfully.
Alternatively, if you do not have the file, but do have the serial number, ColdSync™ can download and install the curve for you.
Follow steps 1 to 3 above.
At the top of the window, press Download Curve. A window will open allowing you to enter the serial number of the sensor.
Enter the serial number. If successful, the window will display the sensor model number. Press import curve to continue.
Navigate to the upper left of the window and press the Save All button.